Real Estate Market's Analysis for rental vacation

Note: Documentation available on the GitHub Repository is currently in Spanish. It will be soon updated to English.
Table of Contents
1. Introduction
The client for this project is a real estate company that invests in large cities by purchasing properties to rent out as vacation apartments. The managers have decided to invest in Madrid and are interested in analyzing publicly available data from the sector leader, Airbnb, to identify the types of properties with the greatest commercial potential for vacation rentals.
As the main deliverable, the management expects to receive a detailed typology of properties that the valuation team should target among the existing opportunities in the city, as well as the primary neighborhoods or geographic areas to focus on.
Notes:
- This article presents a technical explanation of the development process followed in the project.
- Source code can be found here.
2. Objectives
The main objective is to identify the property profiles with the highest potential in the vacation rental market. This can guide the valuation team on where to start looking for such opportunities and highlight the key neighborhoods and geographical areas, which are most promising to focus on.
This analysis is primarily conducted in terms of rental prices, occupancy levels, and purchase prices.
3. Project Design
This project has been designed by taking into consideration the following levers, KPIs, and entities from which data have been obtained.
3.1 Levers
The levers for this project are clear and are summarized below:
Rental price: The higher the rental price per night, the greater the profitability.Occupancy rate: The more days per year a property can be rented, the greater the profitability.Purchase price: The cheaper the property can be acquired, the greater the profitability.
3.2 KPIs
The KPIs that results from the above-mentioned levers are the following:
Rental price: It is calculated as the price paid per night in euros based on the data registered by Airbnb.Occupancy rate: It is calculated as the number of days per year that the property is rented in percentage.Property purchase price: It is calculated by multiplying the number of square meters by the average price per square meter in the area where the property is located. Additionally, we apply a 25% discount to the official price, assuming that our purchasing team can negotiate that.
3.3 Entities and Data
The real data used in this project is collected from Airbnb and Idealista platforms. The most relevant entities from which we can obtain data are summarized below:
Properties: Location, rental price, room type, reviews, minimun/maximum nights, number of bedrooms, beds, …Hosts: Name, id, url, location, verifications, …Locations: Neighborhood, district, latitude, longitude, …
4. Data Quality
In this stage of the project, general data quality correction processes have been applied, such as:
- Data renaming.
- Type correction.
- Proper selection of the most relevant data for the project.
- Analysis of nulls and duplicated registers.
- Analysis of numerical and categorical variables.
- Imputation of nulls through a crosstab analysis.
- Discretization of variables.
- Creation of new variables: square meters estimation, purchase price estimation, …
The entire process can be consulted in detail here.
5. Exploratory Data Analysis
The aim of this phase of the project is to identify trends and patterns that can be transformed into insights, providing valuable information for our project. To achieve this, we perform various statistical evaluations and create graphical representations.
In order to guide this process, a series of seed questions are proposed to serve as a basis for the analysis.
5.1 Seed questions
Regarding rental price:
Q1: What is the average price and price range, by districts and neighborhoods?Q2: What is the ranking of districts and neighborhoods by average rental price?Q3: What factors (other than location) determine the rental price?Q4: What is the relationship between the size of the property and the price at which it can be rented?Q5: How does competition (number of available properties per neighborhood) influence the rental price?Q6: How do prices vary by type of rental (whole apartment, private room, shared room)?
Regarding occupancy rate:
Q7: What is the average occupancy rate by district and by neighborhood?Q8: How likely is the occupancy rate in each district?Q9: What is the ranking of districts and neighborhoods by occupancy rate?Q10: What factors (other than location) determine occupancy rate?Q11: What is the relationship between property size and occupancy rate?Q12: How does competition (number of properties available per district) influence occupancy rate?
Regarding purchase price:
Q13: What is the ranking of price per m2 by district?Q14: What is the ranking of property price (m2 * average size) by district?Q15: What is the relationship between property price and rental price by district?Q17: What is the relationship between property price and occupancy by district?
5.2 Insights
Once the exploratory data analysis has been conducted, the following insights have been obtained:
Insight 1: Ten neighborhoods with a high investment potential have been identified.Insight 2: It is recommended to search for two-bedroom properties that can accommodate 4 guests.Insight 3: It is recommended to search for properties in one of the identified neighborhoods that are not necessarily close to points of interest.Insight 4: A new business model based on rentals for specific moments of high sporting interest should be explored.
A more detailed analysis of this stage can be found here.
6. Results Communication
In this stage of the project, we are presenting the insights that we have obtained during the exploratory data analysis and the main conclusions for each of them.
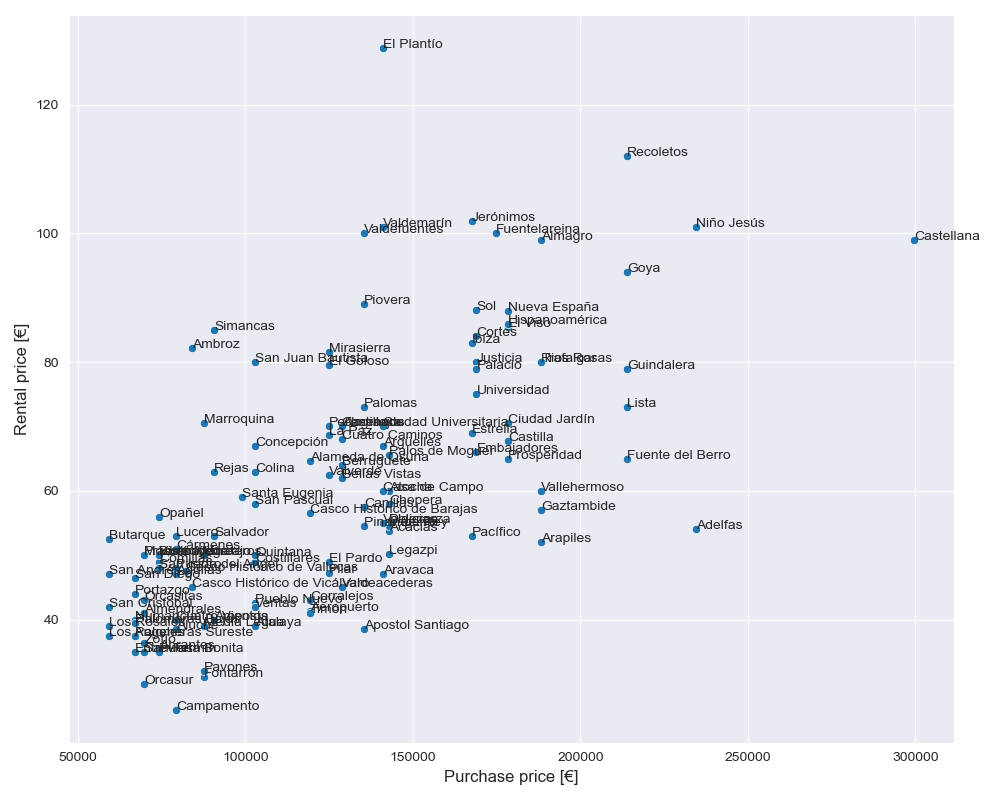
- They can be segmented into 4 groups depending on the type, quality, and property location.
- These 4 groups, which have been identified, are the following:
- Low cost Investment: Simancas, Ambroz, Marroquina, San Juan Bautista.
- Medium cost investment: El Plantio, Valdemarín, Valdefuentes.
- Medium-high cost investment: Jerónimos, Fuentela reina.
- High cost investment: Recoletos.
- The number of guests that maximize the rental price while minimizing the property’s purchase price is 4.
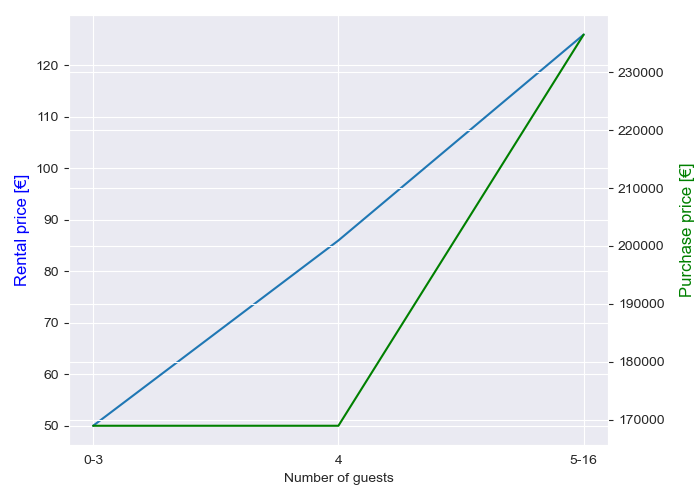
- These properties are expected to have a lower purchase price.
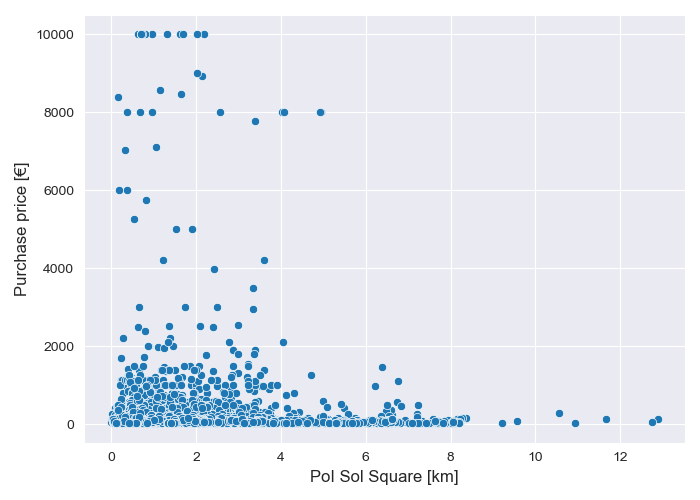
- It seems that proximity to points of interest does not have a particular impact on rental prices.
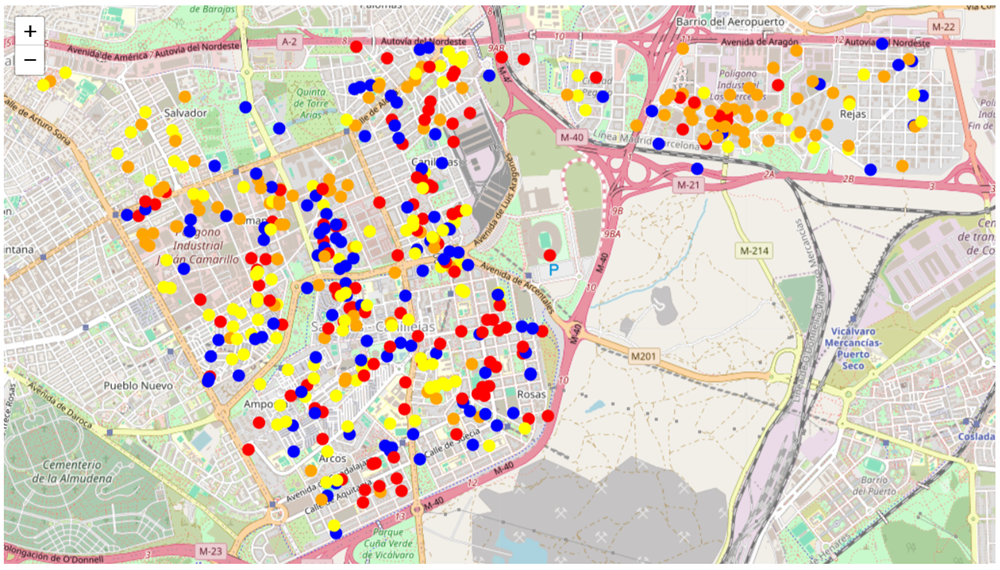
- It is advisable to look for opportunities in the San Blas neighborhood.
- These properties present a particularly high cost-income ratio per night.
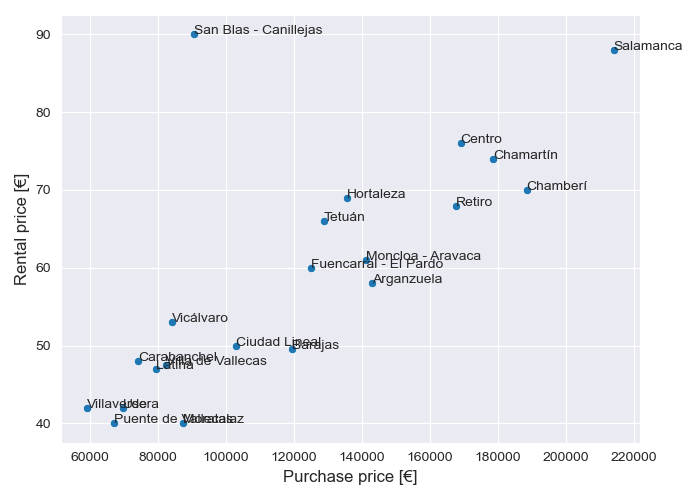
- There are still many rentals that are not exploiting this potential.
Pablo Esteban
Data Scientist and PhD in Mechatronics. I’m passionate about solving problems and optimizing processes, especially those related to coding and business knowledge.