Detection of Inefficiencies in Photovoltaic Solar Plants

Note: Documentation available on the GitHub Repository is currently in Spanish. It will be soon updated to English.
Table of Contents
1. Introduction
The client for this project is a photovoltaic solar power generation company. This company, which operates nationwide, has detected anomalous behaviors in two of its plants. However, the maintenance team cannot identify the cause of the problem.
Before dispatching a team of engineers, they have requested the data science team to analyze the sensor and performance data to identify the potential root cause of the issue.
Notes:
- This article presents a technical explanation of the development process followed in the project.
- Source code can be found here.
2. Objectives
The main objective is to analyze the data from the past month for the two affected solar plants and investigate the root cause of the problem. Based on this analysis, the company will decide whether to dispatch a team of engineers to the plants or apply another solution.
3. Project Design
This project has been designed by taking into consideration the following levers, KPIs, and entities from which data have been obtained. In addition, a brief scheme of how this photovoltaic solar plants works, is presented below.

3.1 Levers
The levers for this project are clear and are summarized below:
Irradiation: Higher irradiation typically leads to greater DC generation. However, the relationship is not strictly monotonic; at certain levels, increased temperatures can reduce generation capacity.Condition of the Panels: Panels must be clean and fully operational to maximize DC energy generation.Efficiency of the Inverters: While some loss is inevitable in the conversion from DC to AC, it should be minimized. Inverters must be in good condition and functioning properly.Meters and Sensors: Accurate measurement is crucial. If meters and sensors fail, we lose traceability and the ability to detect faults.
3.2 KPIs
Irradiation: Measures the solar energy received in watts per square meter.Ambient and Module Temperature: Measured by the plant sensors in degrees Celsius.DC Power: Measures the kilowatts of direct current.AC Power: Measures the kilowatts of alternating current.Inverter Efficiency: Measures the conversion efficiency from DC to AC. It is calculated as (AC / DC) * 100.
3.3 Entities and Data
The most relevant entities and data, which are available in the collected information, are summarized below:
Available information: The information is collected in windows of 15 minutes during 34 days.Number of plants: Two plants.Number of inverters: Several inverters for each of the affected plants.Number of sensors: Just one sensor for each plant. Those sensors are measuring not only the irradiation but also the ambient and modules temperature.
4. Data Quality
In this stage of the project, general data quality correction processes have been applied, such as:
- Data renaming.
- Type correction.
- Proper selection of the most relevant data for the project.
- Analysis of nulls and duplicated registers.
- Analysis of numerical and categorical variables.
- Creation of new variables: efficiency, indicators for null DC generation, …
The entire process can be consulted in detail here.
5. Exploratory Data Analysis
The aim of this phase of the project is to identify trends and patterns that can be transformed into insights, providing valuable information for our project. To achieve this, we perform various statistical evaluations and create graphical representations.
In order to guide this process, a series of seed questions are proposed to serve as a basis for the analysis.
5.1 Seed questions
Regarding irradiation:
Q1: Does sufficient irradiation reach the plants every day?Q2: Is it similar at both plants?Q3: How is it distributed by hour?Q4: How is it related to ambient temperature and module temperature?
Regarding the plants:
Q5: Do they receive the same amount of irradiation?Q6: Do they have a similar number of inverters?Q7: Do they generate a similar amount of DC?Q8: Do they generate a similar amount of AC?
Regarding DC generation:
Q9: What is the relationship between irradiation and DC generation?Q10: Is it affected at any point by the ambient or module temperature?Q11: Is it similar at both plants?Q12: How is it distributed throughout the day?Q13: Is it consistent over the days?Q14: Is it consistent across all inverters?Q15: Have there been moments of failure?
Regarding AC generation:
Q16: What is the relationship between DC and AC generation?Q17: Is it similar at both plants?Q18: How is it distributed throughout the day?Q19: Is it consistent over the days?Q20: Is it consistent across all inverters?Q21: Have there been moments of failure?
Regarding meters and sensors:
Q22: Are the irradiation data reliable?Q23: Are the temperature data reliable?Q24: Are the DC data reliable?Q25: Are the AC data reliable?Q26: Are the data similar between both plants?
5.2 Insights
Once the exploratory data analysis has been conducted, the following insights have been obtained:
Insight 1: Both solar plants are receiving approximately the same amount of energy.Insight 2: The quality of the data is pretty bad.Insight 3: Plant 2 generates much lower levels of DC even at similar levels of irradiation.Insight 4: Plant 1 has a very low capacity to convert DC to AC.Insight 5: Inverters in Plant 2 are receiving high quantities of zero DC production.Insight 6: Inverters in Plant 1 are not working properly.
A more detailed analysis of this stage can be found here.
6. Results Communication
In this stage of the project, we are presenting the insights that we have obtained during the exploratory data analysis and the main conclusions for each of them.
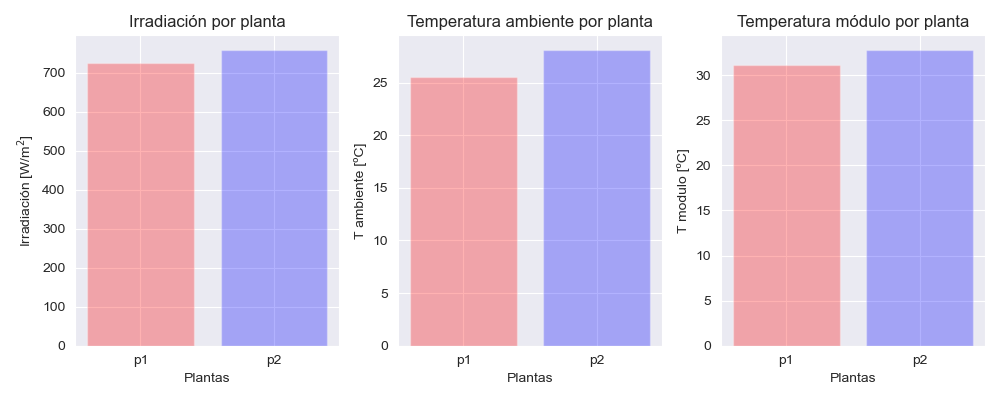
The two affected solar plants are receiving approximately the same energy levels based on irradiation, ambient temperature, and temperature reached by the photovoltaic modules. Moreover, the following data has been found in the sensors analysis:
- Irradiation is working on the modules from 7 am to 5 pm.
- Maximum irradiation is reached from 11 am to 12 am.
- Maximum ambient temperature is reached from 2 pm to 4 pm.
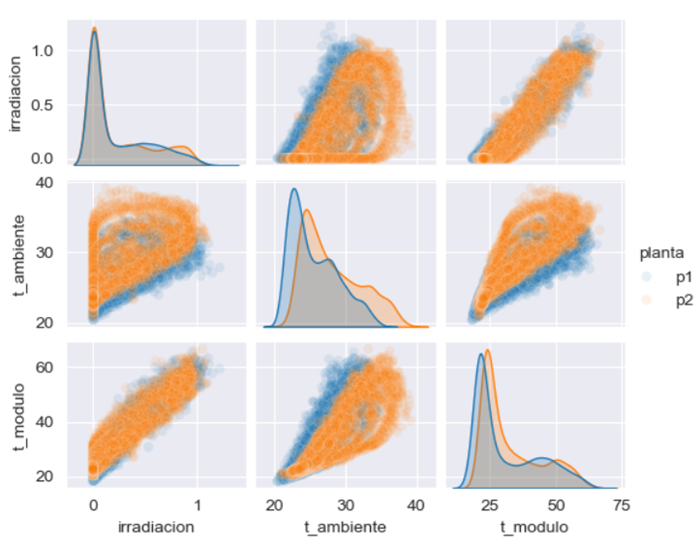
- A deeper anaysis on these quantities is also conducted. The irradiation levels seems to be more connected with the modules than the ambient temperature in both plants.
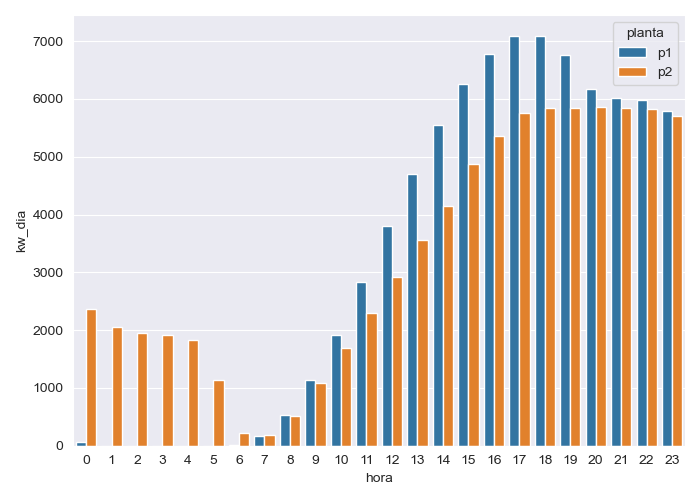
The amount of KW registered per day is not trustworthy in either of the two affected plants.
- Plant 1 presents a peak in the cumulative variable kw_dia, which should not be there.
- Plant 2 presents cumulative data at the earliest hours of the day. It should not be possible.
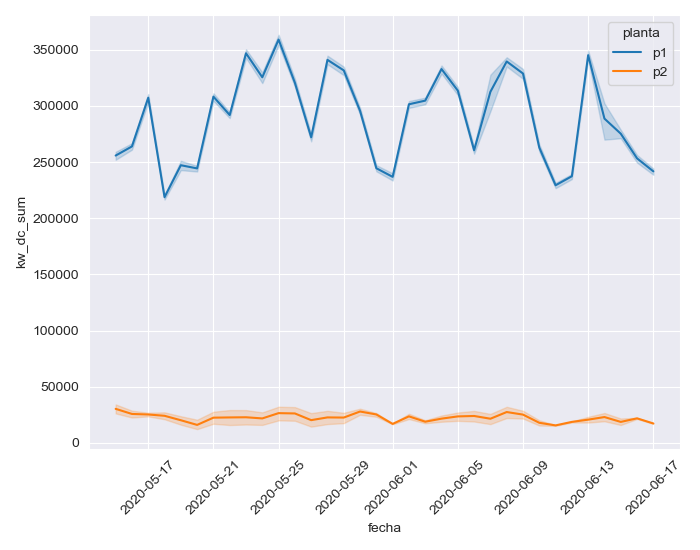
- The registered amounts of KW of DC and AC are also weird, since the kw_dc registered in Plant 1 is ten times larger than in Plant 2.
At this stage of the project, the data collection processes and their reliability needs to be reviewed. However, for educational purposes, we will proceed with the analysis under the assumption that the values of DC and AC are correct.
It seems that Plant 1 generates much more DC than Plant 2 for the same levels of irradiation and temperature.
- Furthermore, Plant 1 has much more variability, while Plant 2 is more consistent.
- It seems that Plant 1 has a very poor conversion from DC to AC.
- Plant 2 presents a regular conversion but there is a strange reduction of efficiency in the middle hours.
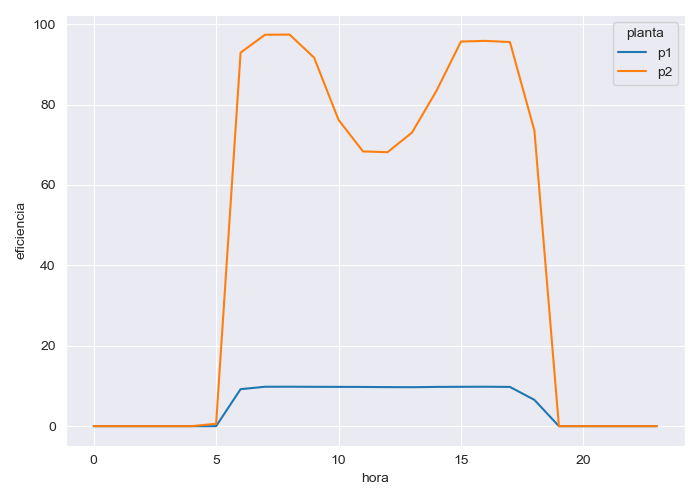
- The strange reduction of efficiency in Plant 2 is due to the high quantities of zero DC production that is coming to the affected inverters.
- Inverters in Plant 1 does not present this problem.
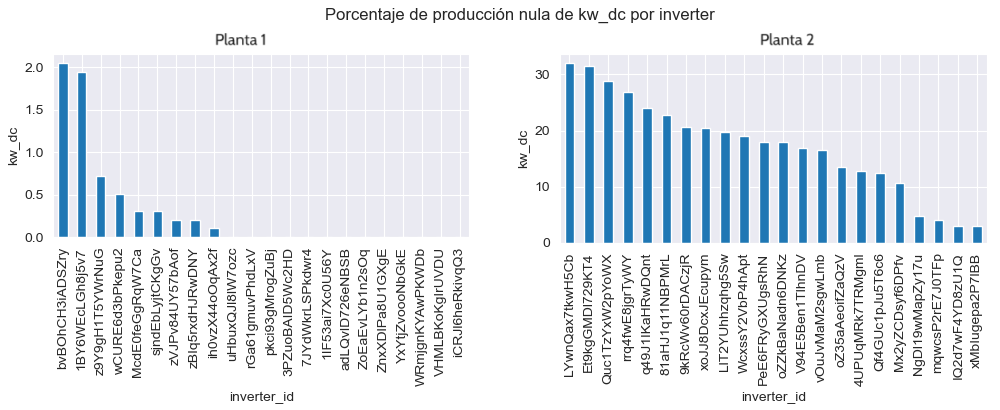
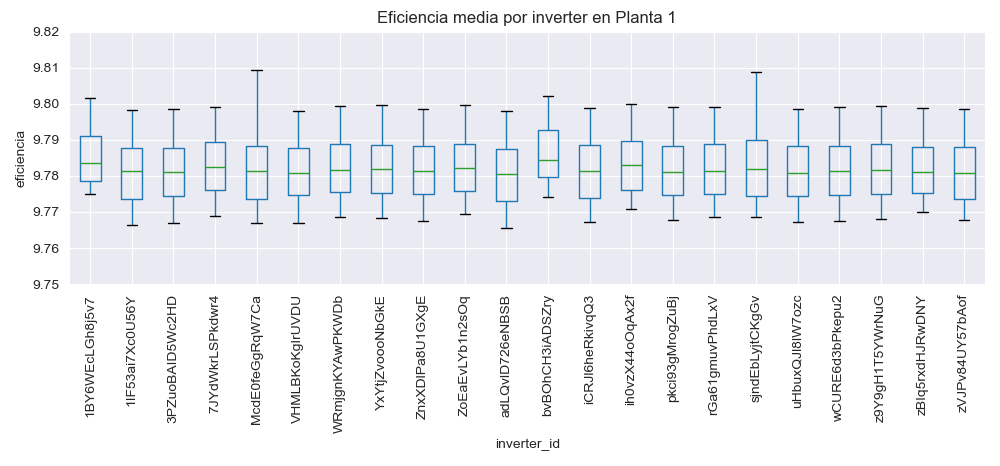
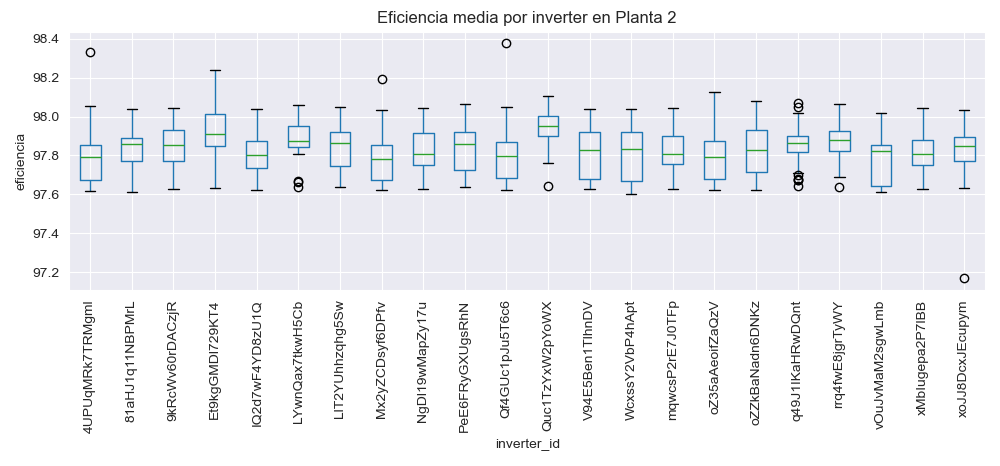
- Inverters in Pant 1 are not working as they should. The maintenance team has to fix them.
- Inverters in Plant 2 are working fine, so their modules needs to be inspected.
- Review the data collection processes and their reliability.
- Perform a maintenance inspection on the modules connected with the identified inverters in Plant 2, since there are many moments of zero DC generation.
- Perform a maintenance inspection of all inverters in Plant 1.