Analysis and Optimization of an Ecommerce Company

Note: Documentation available on the GitHub Repository is currently in Spanish. It will be soon updated to English.
Table of Contents
1. Introduction
The client for this project is a cosmetics ecommerce company based in Russia. They have experienced flat growth over the past few months and have hired us to analyze their transactional data and implement Conversion Rate Optimization (CRO) actions to reverse this situation.
Notes:
- This article presents a technical explanation of the development process followed in the project.
- Source code can be found here.
2. Objectives
The main objective is to analyze the transactional data to identify potential CRO actions that can increase visits, conversions, and average ticket size, thereby boosting the overall revenue of the ecommerce company. To achieve this goal, we will create advanced analytical assets such as:
RFM Segmentation: Analyzing customer data based on Recency, Frequency, and Monetary value to identify key customer segments and tailor marketing strategies accordingly.Recommendation System: Developing a recommendation system to personalize the shopping experience, encouraging higher conversions and increasing the average ticket size.
These tools will help us implement effective CRO actions and drive substantial revenue growth.
3. Project Design
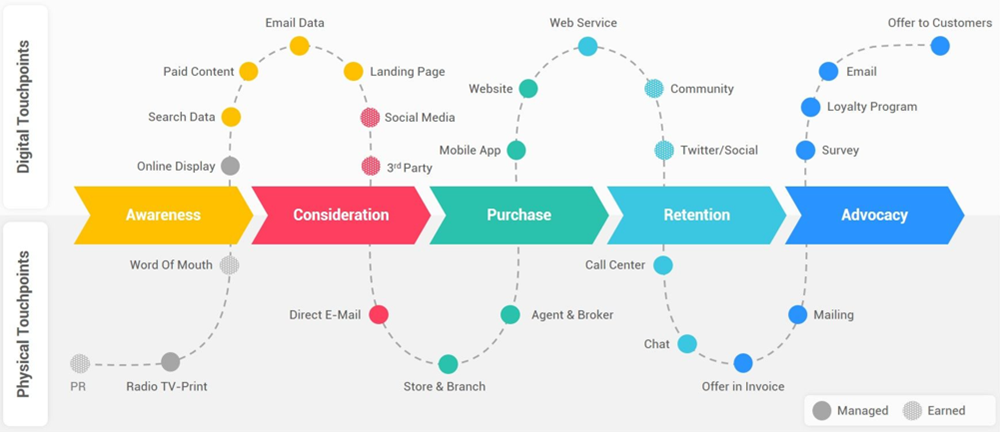
To establish the levers, a brief explanation about the customer journey is requiered. The first step is when a user visits the ecommerce website. Typically, they will come from:
Paid campaigns: Paid ads such as Facebook Ads or Google Ads.Organic content: Blog, social media, etc.Direct traffic: Knows the URL and enters it directly into the browser.
The second step occurs when the user browses the website and adds a product to the cart.
- They can remove products from the cart, exit without making a purchase, or ultimately place an order.
- A common process is cross-selling, where other products that might interest the user are recommended.
The third step involves customer re-engagement through retargeting or email marketing.
3.1 Levers
The levers for this project are clear and are summarized below:
Customer journey: How can we optimize each step of the process?Customers: How can we use available customer information to optimize our campaigns?Products: How can we optimize the product catalog and personalize which products we present to each customer?
3.2 KPIs
The KPIs that results from the above-mentioned levers are the following:
Views: Number of views of the products available in the ecommerce website.Conversion rate: Number of items that are finally purchased from the views in the ecommerce website.Purchase frequency: Number of times a user makes a purchase on the ecommerce website.CPA (Cost Per Acquisition): Aggregate cost of acquiring a customer through a marketing campaign.AOV (Average Order Value): Average value of customer shopping carts, providing insight into the average amount users spend on the ecommerce site.LTV (Lifetime Value): Predicts the average profit from a customer throughout their entire lifetime as a buyer on the ecommerce site.Churn rate: Metric indicating the number of customers who no longer purchase services from the ecommerce site.
3.3 Entities and Data
The most relevant entities from which we can obtain data are summarized below:
User: User ID.Date: Operation date.Session: Session ID.Event: View, add to cart, remove from cart, purchase.Product: Category, product id, price.
4. Data Quality
In this stage of the project, general data quality correction processes have been applied, such as:
- Data renaming.
- Type correction.
- Proper selection of the most relevant data for the project.
- Analysis of nulls and duplicated registers.
- Analysis of numerical and categorical variables.
- Discretization of variables.
- Creation of new variables.
The entire process can be consulted in detail here.
5. Exploratory Data Analysis
The aim of this phase of the project is to identify trends and patterns that can be transformed into insights, providing valuable information for our project. To achieve this, we perform various statistical evaluations and create graphical representations.
In order to guide this process, a series of seed questions are proposed to serve as a basis for the analysis.
5.1 Seed questions
Regarding customer journey:
Q1: What does a typical shopping process look like?Q2: How many products are viewed, added to cart, abandoned and purchased on average per session?Q3: How have these metrics been trending in recent months?
Regarding clients:
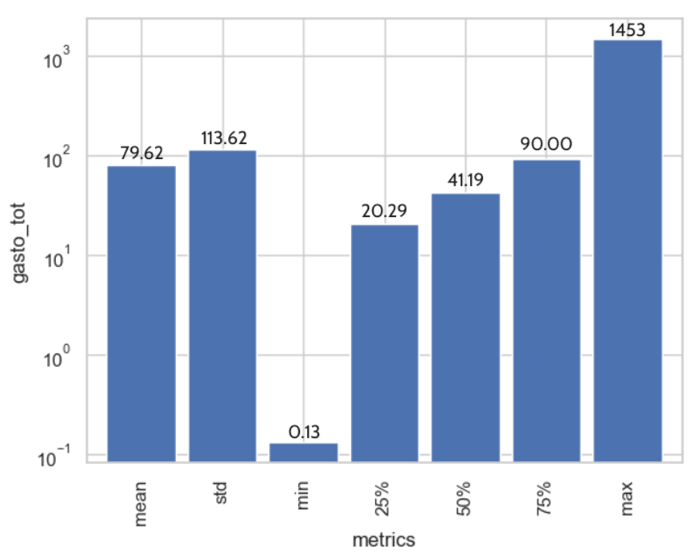
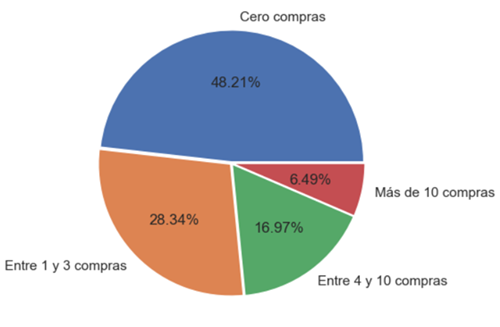
Q4: How many products does each customer buy?Q5: How much does each customer spend on average?Q6: Are there ‘good customers’ that need to be identified and treated differently?Q7: Do customers repeat purchases in the following months?Q8: What is the average LTV of a customer?Q9: Can campaigns can be tailored to customer’s value?
Regarding products:
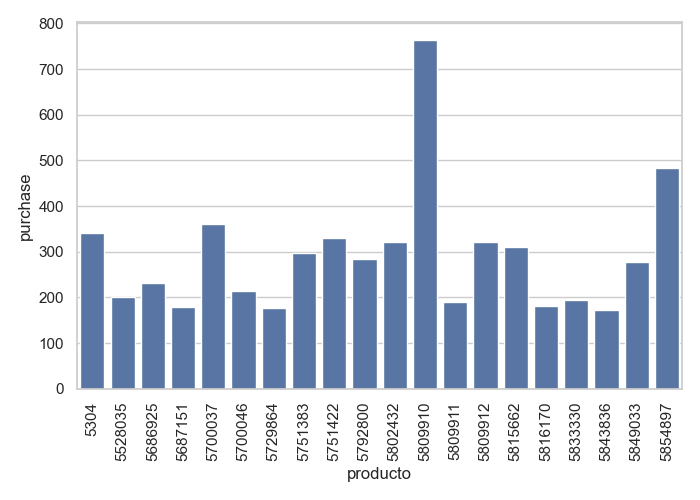
Q10: What are the best-selling products?Q11: Are there products that do not sell?Q12: Is there a relationship between the price of the product and its sales volume?Q13: Are there products that are visited but not purchased?Q14: Are there products that are recurrently removed from the cart?Q15: Could personalized product recommendations be made for each customer?
5.2 Insights
Once the exploratory data analysis has been conducted, the following insights have been obtained:
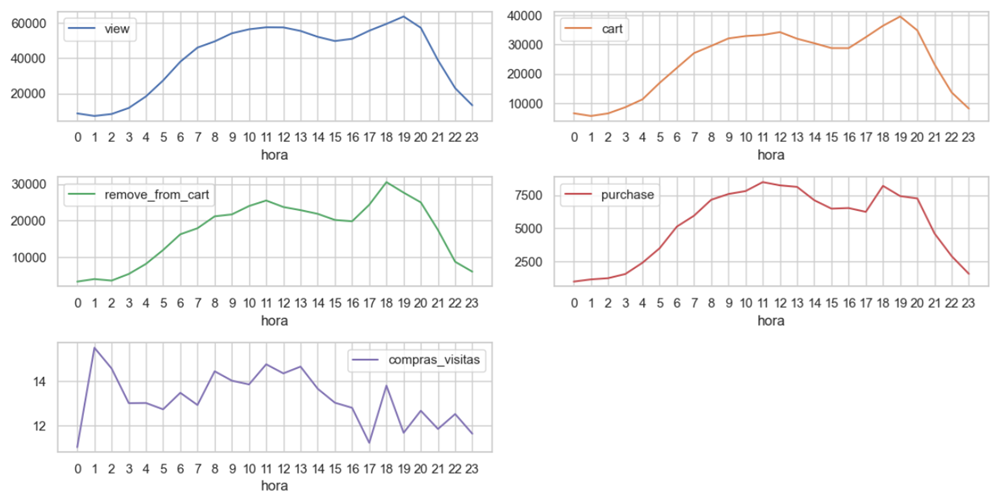
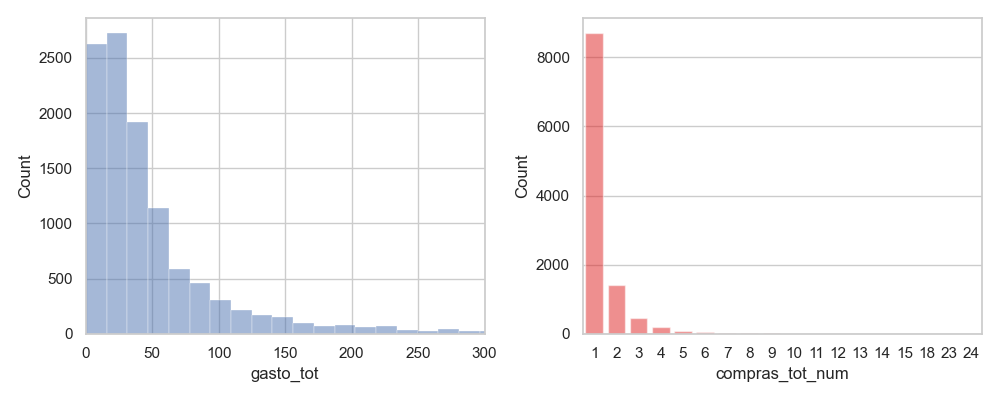
Insight 1: The conversion rates are very poor.Insight 2: The average session numbers are low.Insight 3: The most popular purchasing hours are at 1 am, 8 am, from 11 am to 1 pm, and at 6 pm.Insight 4: Weekly trends show a peak on the 22nd, possibly due to the start of Black Friday week.Insight 5: Most customers make only one purchase and spend an average of less than 50€.Insight 6: 90% of new customers do not make a repeat purchase in the subsequent months.Insight 7: The average LTV is 42€.Insight 8: Prime customers are identified though the RFM analysis.Insight 9: Nearly half of the products have not been purchased in the last five months.Insight 10: A powerful recommendation system adapted to the user’s views is developed.
A more detailed analysis of this stage can be found here.
6. Results Communication
In this stage of the project, we are presenting the insights that we have obtained during the exploratory data analysis and the main conclusions for each of them.
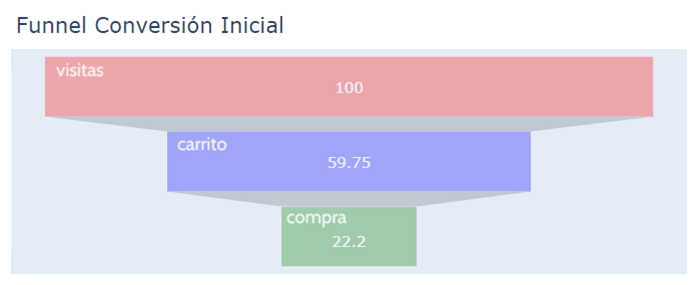
- 60% from views to cart additions.
- 22% from cart additions to purchases.
- 13% from views to purchases.
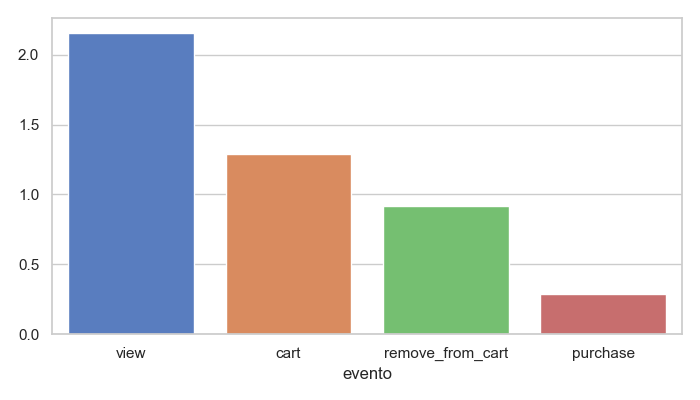
- 2.2 products are viewed.
- 1.3 products are added to the cart.
- 0.9 products are removed from the cart.
- 0.3 products are purchased.
With these values the average monthly revenue is found to be around 125.000€
This information is highly relevant, particularly for strategies involving paid ads, both for generating traffic and for retargeting efforts.
Additionally, there appears to be a user subtype that makes purchases at 1 AM. While not occurring frequently, this group tends to spend significantly when they do make purchases.
- Weekly analysis during the five months:
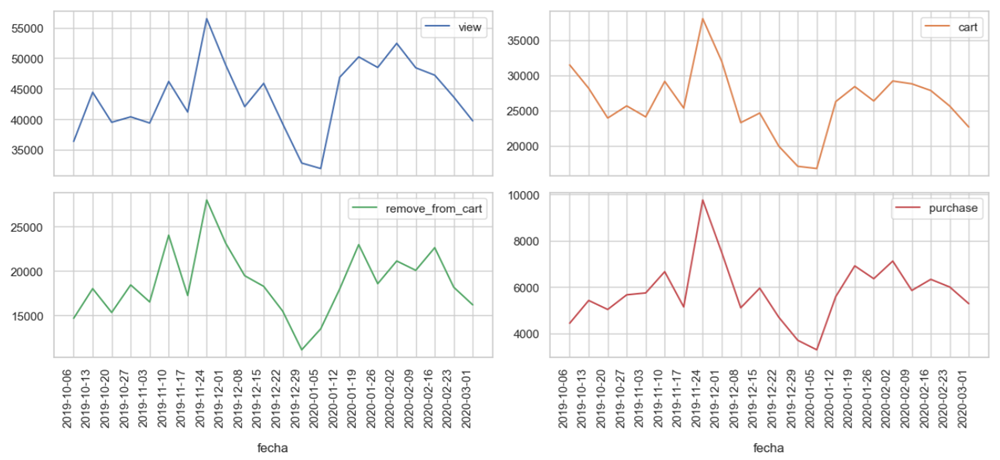
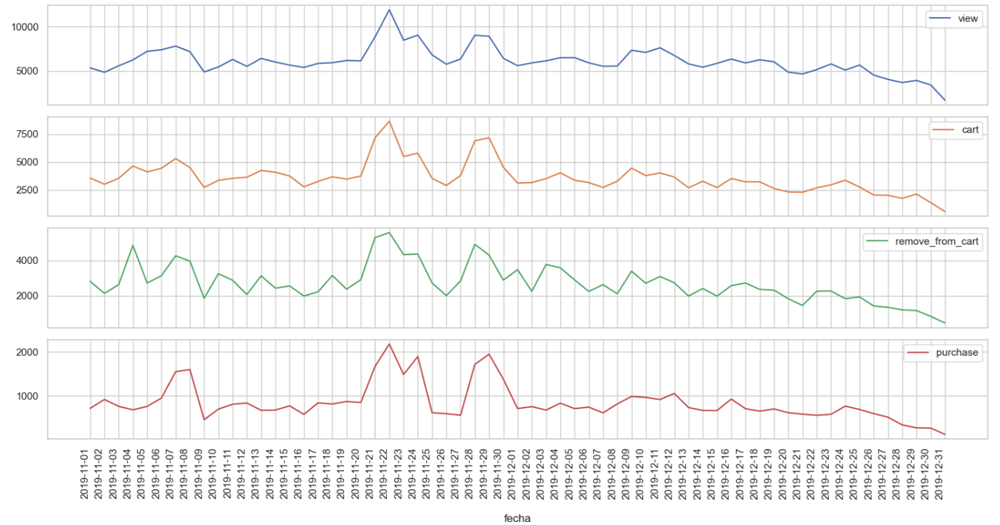
- Daily analysis around the Black Friday campaign:
- The median purchase currently includes only 5 products, indicating there is significant potential for improvement in this ratio through the implementation of recommendation systems.
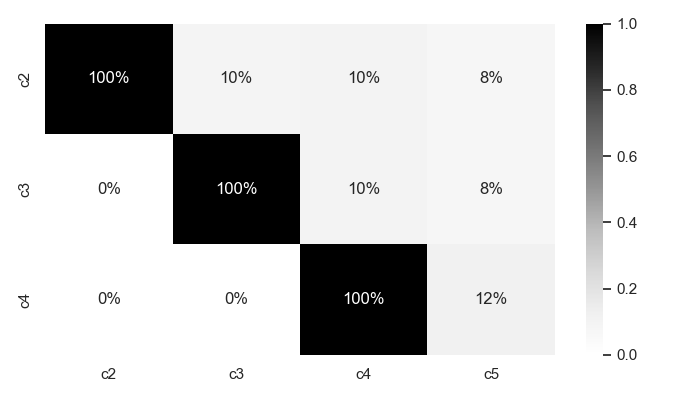
- A customers cohort analysis is performed:
- Implementing CRO actions will increase the LTV, thereby enhancing our strategic advantage.
- Thanks to the RFM analysis, we can identify our top-tier customers and tailor more targeted campaigns based on this information.
- They should be eliminated or, at least, properly investigated.
A basic recommendation system based on the most sold items:
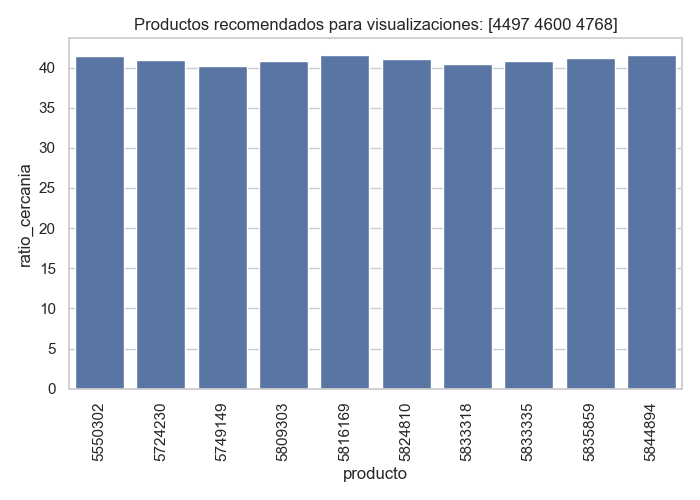
The powerful recommendation system optimised for the customers preferences:
7. Actionable initiatives
A plan of 10 specific initiatives, organized into five major business levers, has been derived from the exploratory data analysis to break the stagnant trend in the company over the last few months and achieve an overall increase in ecommerce revenues:
- Review paid campaigns (generation and retargeting) to focus investment during the time slots between 9 am and 1 pm, and between 6 pm and 8 pm.
- Concentrate investment for the Christmas and post-Christmas period during the Black Friday week.
- Increase investment to reach the maximum CPA based on the identified LTV.
- Preconfigure the homepage with the products identified in the “most viewed” and “most sold” analyses.
- Work on products with a high cart abandonment rate.
- Work on products that are frequently viewed but infrequently purchased.
- The median purchase is 5 products at the moment. To increase this ratio, implement real-time recommendations using the new recommendation system.
- The 90% of the customers only make a single purchase. Create a periodic newsletter using the new recommendation system to increase visit frequency.
- Run promotional campaigns targeting the top segments identified in the RFM segmentation.
- Create a loyalty program based on the new RFM segmentation.
8. Business case implementation
We have also implemented a business case model for a neutral scenario, assuming that the new CRO protocols achieve the following:
- Increase the conversion rate from 13% to 15%.
- Increase the median purchase from 5 to 6 products, representing a 20% increase in this metric.
- Increase the purchase recency from 10% to 12%, representing a 20% increase in this metric.
After one year of applying these protocols, the results are as follows:
- The CRO protocols generated 249300€.
- The cost of implementing the measures was 114000€.
- The resultant profit is 135300€.
- The ROI (Return on Investment) is 118.68%.
The details of this analysis can be consulted here.
Pablo Esteban
Data Scientist and PhD in Mechatronics. I’m passionate about solving problems and optimizing processes, especially those related to coding and business knowledge.